How to Use This Guide
- Download the
.skillfile from the link provided (or install from the Skills library in Claude) - Go to Claude.ai > Settings > Capabilities > Skills
- Upload the
.skillfile - Open a new chat and use the example prompt below
Each skill activates automatically when you describe your task. No special syntax needed.
Pro tip: You can chain multiple skills in a single conversation. For example, run Data Anomaly Detective to find the problem, then Funnel Optimizer to diagnose where users dropped off, then Dashboard Narrative Builder to package the findings for your stakeholders.
01 Data Analysis & Insights
What it does: Upload any structured dataset (CSV, Excel, JSON) and get a full analysis: trend identification, customer segmentation, statistical patterns, and strategic recommendations. Handles data cleaning, outlier detection, and visualization automatically.
Best for: Marketing analysts working with campaign performance data, customer databases, survey results, or any structured dataset that needs pattern discovery and actionable takeaways.
Example prompt:
"Here's a CSV of our last 6 months of campaign performance data across Google Ads, Meta, and LinkedIn. Identify which channels are trending up vs. down, segment by campaign type, and recommend where to reallocate budget next quarter."
02 Data Anomaly Detective
What it does: Applies multiple statistical methods (standard deviation, IQR, trend analysis, seasonality detection) to automatically detect unusual patterns in your metrics. Flags spikes, drops, plateaus, and tracking breaks with confidence scores. Diagnoses root causes and prioritizes alerts by business impact.
Best for: Marketing teams monitoring dashboards, growth teams tracking KPIs, data teams ensuring data quality, agencies managing multiple client accounts.
Example prompt:
"Here's our weekly website analytics export for the last 90 days. Detect any anomalies in traffic, conversion rate, and revenue. For each anomaly, tell me the severity, likely root cause, and whether it needs immediate action."
03 A/B Test Analyzer
What it does: Takes your test data (sample sizes, conversions, revenue per visitor) and calculates statistical significance, effect sizes, confidence intervals, and delivers a clear winner/loser/inconclusive declaration. Prevents common mistakes like calling tests too early or ignoring practical significance.
Best for: Growth teams running website experiments, product managers evaluating feature flags, CRO specialists analyzing conversion tests, marketers testing ad creative or landing pages.
Example prompt:
"I ran an A/B test on our pricing page. Control: 12,450 visitors, 312 conversions. Variant: 12,380 visitors, 358 conversions. Test ran for 21 days. Is this significant? Should I ship the variant or keep testing?"
04 Attribution Modeling
What it does: Analyzes your multi-channel marketing data to determine which channels actually drive conversions vs. which ones take credit. Compares first-touch, last-touch, linear, time-decay, and data-driven attribution models. Outputs budget reallocation recommendations based on true channel contribution.
Best for: Marketing leaders managing multi-channel budgets, performance marketers optimizing spend allocation, agencies reporting channel ROI to clients.
Example prompt:
"Here's our conversion path data showing touchpoints across Google Ads, organic search, email, and LinkedIn for 2,000 conversions. Run attribution modeling across all standard models and tell me which channels are overvalued and undervalued. Recommend how to shift our $50K/month budget."
05 Cohort Analysis
What it does: Groups users by acquisition date, behavior, or custom attributes and tracks their performance over time. Calculates retention curves, lifetime value by cohort, and identifies where engagement breaks down. Outputs visual cohort tables and specific intervention recommendations.
Best for: SaaS product teams tracking onboarding-to-retention, e-commerce marketers analyzing repeat purchase behavior, growth teams identifying which acquisition channels produce the highest-LTV customers.
Example prompt:
"Here's our user signup and activity data for the last 12 months. Build monthly acquisition cohorts and show me retention at Week 1, Week 4, Week 8, and Week 12. Identify which cohorts retained best, what they have in common, and where the biggest drop-off happens."
06 Predictive Analytics Translator
What it does: Takes the output of ML models, forecasting tools, or statistical analyses and translates them into plain-English strategic recommendations. Bridges the gap between data science outputs and business decisions by contextualizing predictions, quantifying uncertainty, and mapping model outputs to specific actions.
Best for: Marketing leaders receiving forecasts from data science teams, product managers interpreting churn predictions, anyone who gets model outputs but needs to turn them into strategy their team can execute.
Example prompt:
"Our data science team built a churn prediction model. Here are the top 500 accounts flagged as high-risk with their risk scores and contributing features. Translate this into a prioritized retention strategy: which accounts to save first, what interventions to use, and how to measure if the outreach is working."
07 Landing Page Optimizer
What it does: Audits any landing page for conversion killers across six dimensions: above-fold content, CTA placement and design, trust signal implementation, page load speed, mobile responsiveness, and UI/UX principles. Provides specific, prioritized fixes with implementation guidance.
Best for: Growth marketers optimizing campaign landing pages, product teams improving signup flows, agencies auditing client pages before launch.
Example prompt:
"Audit this landing page for our SaaS free trial: [URL]. We're getting 15,000 monthly visitors but only a 1.8% conversion rate. Identify the top 5 conversion killers and give me a prioritized fix list I can hand to my developer this week."
08 Content Engagement Analyzer
What it does: Analyzes content performance across LinkedIn posts, blog articles, email campaigns, and social media to identify what drives engagement. Runs length analysis, format comparison, topic performance scoring, timing optimization, and engagement driver identification. Outputs data-driven content strategy recommendations.
Best for: Content marketers optimizing their publishing strategy, social media managers identifying top-performing formats, newsletter editors analyzing subscriber engagement patterns.
Example prompt:
"Here's a CSV export of my last 60 LinkedIn posts with impressions, reactions, comments, shares, and post type. Analyze which formats, topics, and posting days drive the highest engagement rate. Give me a content formula I can repeat."
09 Heatmap Interpreter
What it does: Reads heatmap data (click patterns, scroll depth, attention mapping, mouse movement tracking) and translates it into specific, actionable UX and design recommendations. Goes beyond "users aren't scrolling" to tell you exactly what to move, remove, or redesign and why.
Best for: UX designers interpreting Hotjar/Crazy Egg data, conversion rate optimizers building test hypotheses from behavioral data, product managers prioritizing design changes based on user behavior evidence.
Example prompt:
"Here's our Hotjar scroll map and click heatmap data for our homepage. 68% of users drop off before reaching our pricing section. Only 12% click the primary CTA. Interpret the patterns and give me 5 specific design changes ranked by expected impact on conversion."
10 Dashboard Narrative Builder
What it does: Transforms raw dashboard metrics and KPI data into executive-ready narrative insights. Takes your numbers and produces a polished summary with trend analysis, business impact context, and strategic recommendations written in language that resonates with each stakeholder audience.
Best for: Marketing managers presenting to CMOs, analysts preparing board updates, product managers writing sprint reviews, agency account managers reporting to clients.
Example prompt:
"Here are this month's marketing KPIs: website traffic 145K (down 8% MoM), MQLs 892 (up 12% MoM), pipeline generated $2.1M (up 22% MoM), CAC $187 (down 6% MoM). We launched a new ABM campaign mid-month. Write an executive summary for our CMO that explains the story behind these numbers."
11 Funnel Optimizer
What it does: Takes your stage-by-stage funnel data and pinpoints exactly where users drop off, compares each stage to industry benchmarks, and tells you which fix will recover the most revenue. Works with marketing funnels, product onboarding funnels, sales pipelines, and checkout flows.
Best for: Growth marketers diagnosing signup flow leaks, e-commerce teams optimizing checkout, SaaS product managers tracking onboarding, sales ops reviewing pipeline health.
Example prompt:
"Here's our SaaS signup funnel data for Q1: Landing page 45,000 > Signup started 8,100 > Email verified 5,400 > Onboarding completed 2,160 > First value action 864 > Paid conversion 345. Where are we losing the most potential revenue and what's the single highest-impact fix?"
12 Creative Testing Insights Reporter
What it does: Takes raw A/B creative test data and translates it into repeatable design principles. Instead of just telling you "Variant B won," it extracts the underlying patterns (color psychology, copy structure, layout principles, emotional triggers) so your design team can systematically produce more winners.
Best for: Creative teams running ad tests, performance marketers optimizing creative rotation, brand managers establishing creative best practices from test data.
Example prompt:
"Here are the results of our last 8 Meta Ads creative tests with CTR, conversion rate, and ROAS for each variant. The winning creatives share some visual patterns but I can't articulate what. Analyze the data and extract 5 design principles we can brief our designers on for the next round."
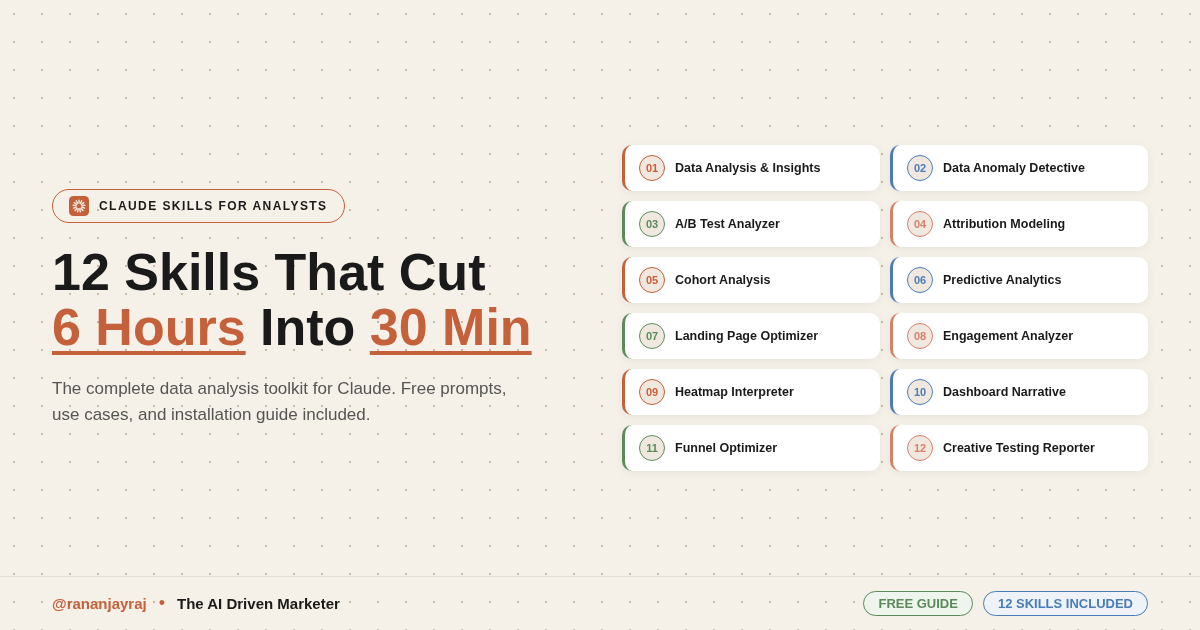
Quick Reference All 12 Skills at a Glance
# | Skill | Core Output |
|---|---|---|
01 | Data Analysis & Insights | Trends, segments, strategic recommendations from any dataset |
02 | Data Anomaly Detective | Anomaly detection, root cause diagnosis, prioritized alerts |
03 | A/B Test Analyzer | Statistical significance, confidence intervals, winner declaration |
04 | Attribution Modeling | Channel contribution analysis, budget reallocation recommendations |
05 | Cohort Analysis | Retention curves, LTV by cohort, drop-off intervention plans |
06 | Predictive Analytics Translator | ML outputs translated to plain-English strategy and actions |
07 | Landing Page Optimizer | Conversion audit, prioritized fixes, implementation guidance |
08 | Content Engagement Analyzer | Format/topic/timing analysis, data-driven content formulas |
09 | Heatmap Interpreter | Behavioral pattern analysis, specific UX/design fixes |
10 | Dashboard Narrative Builder | Executive-ready narratives, trend analysis, strategic recommendations |
11 | Funnel Optimizer | Drop-off diagnosis, benchmark comparison, revenue recovery priorities |
12 | Creative Testing Insights Reporter | Test data translated into repeatable design principles |
Why Claude Skills Instead of a ChatGPT Prompt?
A prompt tells Claude what to do once. A skill teaches Claude a repeatable workflow it activates automatically with built-in methodology, reference files, and Python scripts that run locally. The output is consistent every time, without re-explaining your process.
These 12 skills replace hours of manual data work per week.
Skill Chaining - Recommended Workflows
Workflow 1: Full Campaign Performance Audit Data Analysis & Insights > Data Anomaly Detective > Attribution Modeling > Dashboard Narrative Builder
Upload your campaign data. Get the analysis, flag anything unusual, understand true channel contribution, and package it all into an executive summary.
Workflow 2: Conversion Rate Optimization Sprint Landing Page Optimizer > Heatmap Interpreter > Funnel Optimizer > A/B Test Analyzer
Audit the page, interpret user behavior, find the funnel leak, then design and analyze the test to fix it.
Workflow 3: Content Strategy Reset Content Engagement Analyzer > Cohort Analysis > Creative Testing Insights Reporter > Predictive Analytics Translator
Find what content works, understand which audience segments it resonates with, extract the creative patterns, and forecast what to double down on.
Download
|

Want more Claude breakdowns like this? Follow @rananjayraj on LinkedIn for weekly AI tool guides, marketing automation workflows, and practical Claude tutorials.
LinkedIn | The AI Driven Marketer | Website | Github | Youtube